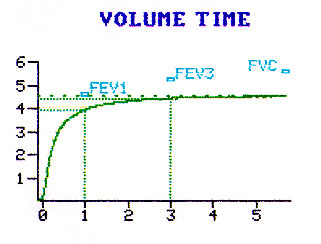
The amount of air that can be blown in the first second in the FVC maneuvere.
Note this amount in volume time graph..

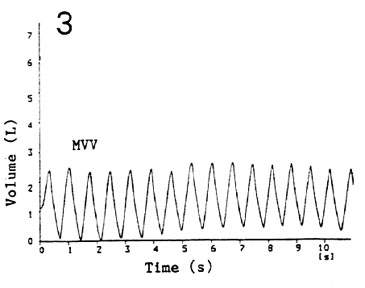
Forced Vital capacity (FVC)
Total amount of air that can be blown out after a maximal deep breath, as fast as you can.
Note this amount in volume time graph.
Best of 3 attempts is taken.
The normal range is 80-120% predicted.
Forced Expired Volume in One second (FEV1)
The amount of air that can be blown in the first second in the FVC maneuvere.
|
|
| The normal range for FEV1 is 80-120% predicted |
FEV1/FVC
FEV1 volume devided by FVC expressed as percent.
I am going to create some confusion. There are two ways of judjing the normal range.
FEF25-75
Forced expiratory flow rate between 25 to 75% of FVC.
This used to be called maximal mid expiratory flow rate.
We are looking at the flow rate of the mid portion of FVC. Note this in the volume time
graph.
The normal range is 75-125%.
This measure is thoght to represent early evidence for obsruction.
| Peak expiratory flow rate. Note the location of PEFR in the flow volume loop. This graph represents flow rate against lung volume. Peak flow occurs early during forced expiration. Normal range is 80-100%. |
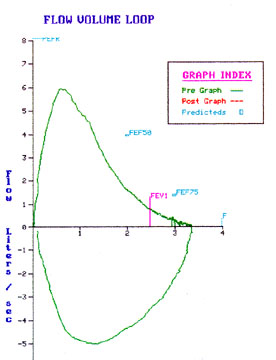 |
| Forced expiratory time(FET) Note the time taken to complete FVC in the volume time graph.
|
|
| PIFR Note the peak inspiratory flow in the flow volume loop graph. Note the difference in configuration of inspiratory and expiratory limbs of flow volume loop. |
|
| FIVC This measure is obtained while performing flow volume loop. I don't use this value much in interpretaion because we never take enough time to seriously measure inspiratory values. |
|
 |
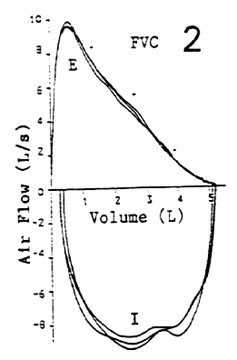
| Maximal voluntary ventilation (MVV) This is the amount of air that can be moved in and out as fast as you can in one minute. We ask the patient to breath as deep and as fast as possible for 10 seconds and
express it for a minute. Click to see how it is performed (not yet). |
Flow Volume Loop
|
 |
|
 |
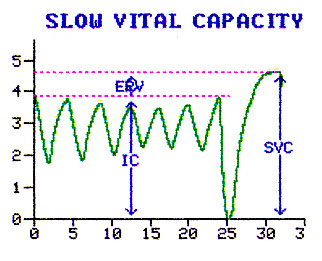
| TV IC ERV SVC |
 |
Maximal Voluntary Ventilation
| Note: Rate Volume |
 |