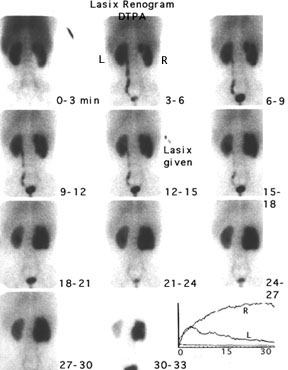
After the venous injection, both kidney take up the radioisotope, DTPA. Notice that although the kidneys are the same size, the center of the right kidney has areas of decreased radioactivity (photopenia); the hilum of the right kidney is lighter grey. This indicates that the kidney has hydronephrosis; the pelvis is so large that the renal parenchyma is stretched over it.
Notice that the left kidneys show peak concentration (computer generated curve in the lower right-hand corner of the image) at about 5-7 minutes. The left kidney promptly drains (the computer curve drops rapidly). The computer curve of the right kidney shows a much more gradual rise and it continues to rise almost to the end of the study. This shows that the right kidney doesn't drain; it is obstructed. Additional studies demonstrated that the obstruction occurred at the ureteropelvic junction.